fooof.plts.periodic.plot_peak_params
-
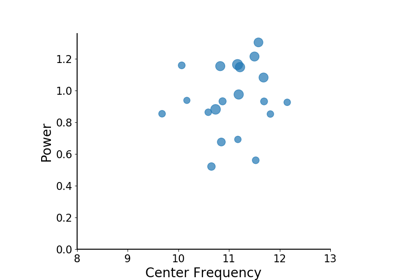
fooof.plts.periodic.plot_peak_params(peaks, freq_range=None, colors=None, labels=None, ax=None, plot_style=<function style_param_plot at 0x7fd2f73007a0>, **plot_kwargs)[source]¶ Plot peak parameters as dots representing center frequency, power and bandwidth.
- Parameters
- peaks2d array or list of 2d array
Peak data. Each row is a peak, as [CF, PW, BW].
- freq_rangelist of [float, float] , optional
The frequency range to plot the peak parameters across, as [f_min, f_max].
- colorsstr or list of str, optional
Color(s) to plot data.
- labelslist of str, optional
Label(s) for plotted data, to be added in a legend.
- axmatplotlib.Axes, optional
Figure axes upon which to plot.
- plot_stylecallable, optional, default: style_param_plot
A function to call to apply styling & aesthetics to the plot.
- **plot_kwargs
Keyword arguments to pass into the plot call.